RStudio’s Four Panes
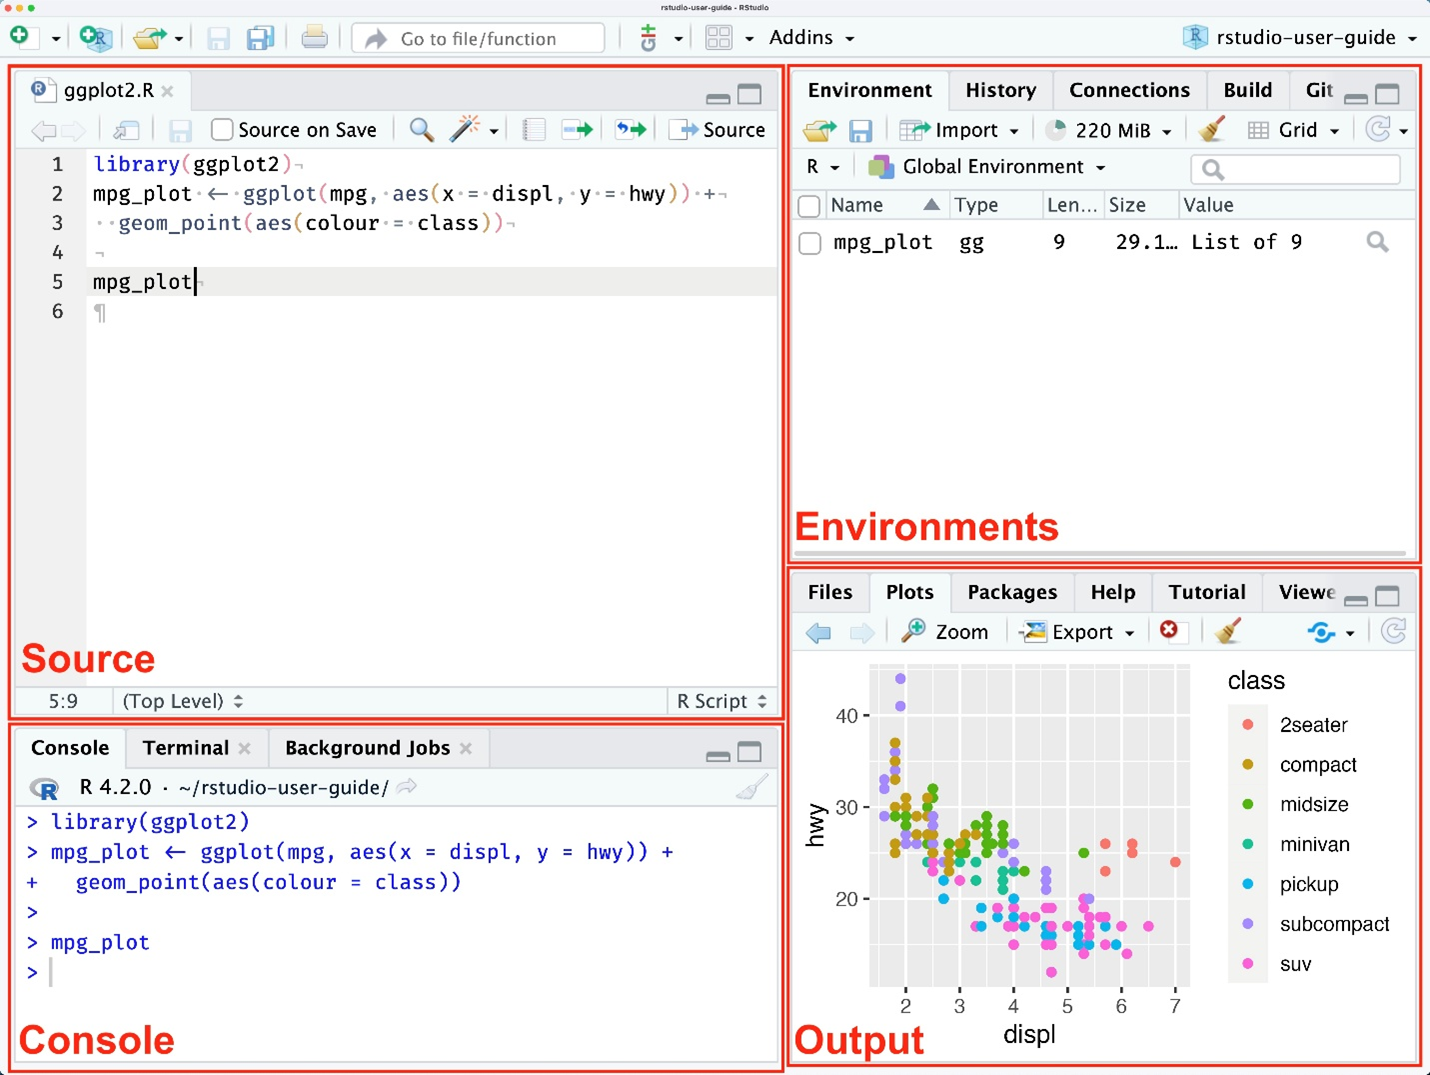
RStudio organizes your work into four panes. Each pane has tabs for specific tasks: editing, running code, viewing objects, managing files, plots, packages, or help. This page gives you a plain-English tour of every pane and every default tab—what each does, when you’ll use it, and where to click next.

1. Source Pane (Top-Left) — Where You Write and Edit
What it is: a multi-tab code and document editor. You’ll draft R scripts (.R), Quarto/R Markdown (.qmd, .Rmd), plain text, and more here. Code doesn’t execute until you send it to the Console.
- Tabs across the top hold open files—click a tab to switch documents.
- For Quarto/R Markdown, you can use the visual editor and render from the toolbar; output previews in the Viewer (see Output pane).
2. Console Pane (Bottom-Left) — Where Code Runs (Plus Two Neighbors)
This column has three tabs by default:
a. Console
An interactive R prompt. Type a command (e.g., 1 + 1) and press Return to see results immediately. Most beginners will (1) write code in the Source pane and (2) send lines or chunks to the Console to execute.
b. Terminal
A system shell inside RStudio (bash/zsh on macOS/Linux; PowerShell/Command Prompt on Windows). Supports multiple sessions—handy for Git, package tools, or command-line utilities.
c. Background Jobs
Runs an R script in a separate R session so long tasks don’t freeze your main session. Start jobs from this tab or by choosing Source as Background Job. Progress and logs appear here.
If something works in the Console but stalls your session, launch it as a background job. If you need shell tools, hop to Terminal.
3. Environment Pane (Top-Right) — What’s in Memory (Plus History & Tooling)
By default this pane includes Environment, History, Connections, Build, VCS, and Tutorial.
- Environment: Live list of objects in your R session (data frames, vectors, models). Inspect, remove, or clear objects and launch the spreadsheet-style data viewer.
- History: Log of commands you’ve executed. Search, select, and resend to Console or a script.
- Connections: Shows active database/data-source connections.
- Build: Appears in projects with build tooling (e.g., an R package). Buttons for Install & Restart, Load All, Run R CMD check, clean/rebuild, and run tests.
- VCS: Git/SVN integration (commit, diff, pull/push, project-level settings).
- Tutorial: Runs interactive learnr tutorials inside the IDE.
4. Output Pane (Bottom-Right) — Files, Plots, Packages, Help, Web Output, Slides
By default this pane includes Files, Plots, Packages, Help, Viewer, and Presentation.
- Files: Browse folders, open files into Source, rename/move/delete, upload/download (when using server/cloud).
- Plots: Displays graphs. Navigate through plot history, pop out to a window, and export (PNG/PDF).
- Packages: Lists installed packages; load/unload with a click. Install/Update tools included.
- Help: Documentation for functions and packages (same as R’s help, in a browser-style panel).
- Viewer: Renders local HTML (Shiny apps, htmlwidgets, Quarto previews, etc.).
- Presentation: IDE panel for authoring HTML5 slides (R Presentations).
Customizing Your Layout
Go to Tools → Global Options → Pane Layout to rearrange panes and choose which tabs live where. If you ever get lost, reset to defaults.
Quick Mental Model
- Source: Write your instructions.
- Console: Run them (plus Terminal/Jobs for power moves).
- Environment: Keeps track of what exists (with History/Connections/Build/VCS/Tutorial beside it).
- Output: Displays what you need—files, plots, packages, help, web output, and slide decks.