The Art of Measurement
From Abstract Ideas to Concrete Evidence
In the preceding chapters, we have journeyed from the spark of a research idea to the formulation of a focused research question or hypothesis. We have established why a study is needed and what, in specific terms, it aims to investigate. Now, we arrive at a critical juncture in the research workflow, a stage where the abstract world of ideas must be systematically and rigorously connected to the concrete world of empirical observation. This is the art and science of measurement.
Consider a seemingly straightforward research question: “Does exposure to political news on social media increase political engagement among young adults?” This question is clear and focused, but it is built on a foundation of abstract concepts: “exposure to political news,” “social media,” and “political engagement.” What, precisely, do we mean by these terms? How would we recognize and record them if we saw them? Is “exposure” simply seeing a headline, or does it require reading an entire article? Does “political engagement” mean voting, or does it include arguing with a relative over dinner, putting a sign in your yard, or sharing a meme? Without unambiguous answers to these questions, our research cannot proceed. We would be building a house on a foundation of sand.
Measurement is the process of making our abstract concepts concrete, observable, and quantifiable. It is the bridge that allows us to travel from the theoretical realm to the empirical realm. The quality of a study’s conclusions can be no better than the quality of its measures. A flawed or ambiguous measurement strategy will produce flawed and ambiguous results, no matter how sophisticated the research design or statistical analysis. This is why measurement is not a mere technicality; it is a central, creative, and intellectually demanding part of the research process.
This chapter demystifies the art of measurement by breaking it down into a two-step translation process. First, we will explore conceptualization, the process of refining and specifying the precise meaning of the abstract concepts that are central to our research. Second, we will delve into operationalization, the process of developing the specific procedures, or “operations,” that will result in empirical observations representing those concepts in the real world. We will also examine the different levels at which we can measure our variables and discuss the crucial criteria of reliability and validity, which allow us to assess the quality and trustworthiness of our measures. By the end of this chapter, you will have the tools to transform your abstract ideas into a concrete plan for gathering credible evidence.
The Two-Step Translation: Conceptualization and Operationalization
At its core, measurement is a process of translation. We begin with concepts, which are abstract mental ideas, and we must translate them into their concrete, empirical counterparts so they can be subjected to the “show me” demands of scientific inquiry. This translation is not a single leap but a deliberate, two-stage journey that moves from the general to the specific.

Conceptualization: Defining Our Terms
The first stage is conceptualization. Conceptualization is the process of clarifying the meaning of our concepts by offering a precise theoretical or nominal definition. It involves refining a fuzzy, everyday notion into a sharp, formal, and unambiguous construct for research purposes. When a researcher conceptualizes a term like “prejudice,” they are specifying exactly what they mean by that term, drawing on previous scholarship to create a working definition that can be clearly communicated to others. This process involves identifying the various facets, or dimensions, of a concept and setting clear boundaries for what is included and what is excluded from the definition.
Operationalization: Devising the Measurement Strategy
The second stage is operationalization. Operationalization is the process of transforming our abstract, conceptualized constructs into their concrete, empirical counterparts, which we call variables. It is the process of devising the specific steps or procedures—the “operations”—that we will use to measure these variables. If conceptualization is about defining a concept, operationalization is about creating a detailed recipe for how to observe and record it. An operational definition specifies the exact procedures employed when carrying out the measurement. For the concept of “political engagement,” an operational definition might be the score a person receives on a survey that asks them to report the frequency with which they have performed a list of specific political acts (e.g., voting, donating money, attending a rally) in the past year.
These two stages are deeply intertwined. Difficulties in the operationalization stage often reveal that we have not achieved sufficient clarity in our conceptualization. The process is iterative, moving back and forth between the abstract definition and the concrete measurement plan until a clear and logical link has been forged between the two.
Step 1: Conceptualization—Achieving Conceptual Clarity
Research begins with concepts. Concepts are the fundamental building blocks of theory, the mental images and abstractions we use to organize our perceptions of the world—terms like “credibility,” “social support,” “media literacy,” or “cultural identity.” In our everyday lives, we use these terms with a vague, common-sense understanding. In research, however, this vagueness is a liability. The process of conceptualization is the disciplined effort to eliminate this ambiguity.
From Concepts to Constructs
Researchers start with concepts, which are mental images comprising observations, feelings, or ideas. When these concepts are intentionally created or adopted for a specific scientific purpose, they are often referred to as constructs. Constructs are theoretical creations that are not based on direct observation but are built to help scientists communicate, organize, and study the world. Terms like “communication apprehension,” “relational satisfaction,” and “parasocial interaction” are constructs that have been carefully defined within the field of communication research. The goal of conceptualization is to produce an explicit conceptual definition (also called a nominal or theoretical definition) that specifies what a researcher means by a term.
This process is not done in a vacuum. A crucial first step is to consult and review the relevant scholarly literature. How have other researchers who have studied this topic defined this concept? What are the established definitions? Are there competing or conflicting definitions in the field? By grounding your conceptualization in the existing literature, you are entering the ongoing scholarly conversation and ensuring that your work is connected to the body of knowledge that has come before it.
Identifying Indicators and Dimensions
Many of the concepts we study in communication are highly abstract and multifaceted. The process of conceptualization involves breaking these complex concepts down into their constituent parts by identifying their indicators and dimensions.
An indicator is an observation that we choose to consider as a reflection of the variable we wish to study. It is an observable marker of a concept’s presence or absence. For example, if we are studying the concept of “professionalism” in the workplace, we might consider the following as indicators: arriving on time, dressing in a certain way, or using formal language in emails. None of these indicators alone is the concept of professionalism, but they are all observable phenomena that can point to its presence.
Many concepts are so complex that they have multiple facets, or dimensions. A dimension is a specifiable aspect of a concept. For example, a researcher studying “media credibility” might conceptualize it as a multidimensional construct with at least two key dimensions:
Source Credibility: The perceived trustworthiness and expertise of the person or organization delivering the message.
Message Credibility: The perceived accuracy and believability of the information within the message itself.
Specifying these unique dimensions allows for a more complex and refined understanding of the concept. A news report could be high on message credibility (the facts are accurate) but low on source credibility (it comes from a source the audience distrusts), or vice versa. A thorough conceptualization must identify all the relevant dimensions of a concept to ensure that the subsequent measurement strategy is comprehensive and captures the full meaning of the construct.
Step 2: Operationalization—The Recipe for Measurement
With a clear conceptual definition in hand, the researcher’s task is to create a concrete plan for how to measure it. This is the process of operationalization, where we specify the exact operations that will be involved in observing and recording our variables. A variable is the empirical representation of a construct. It is a logical grouping of attributes, which are the specific characteristics or qualities that describe it. For example, “gender” is a variable, and its attributes might be “woman,” “man,” and “non-binary.” Because a variable is comprised of a set of attributes, it is an entity that can take on more than one value. If an attribute does not vary, it is a constant. The operationalization process results in an operational definition, which is a detailed set of instructions—a recipe—for how to measure the variable.
This recipe must be so specific that another researcher could, in principle, replicate the measurement procedure exactly. For example, an operational definition for the variable “physical aggression” in a study of children’s television might be: “The number of times a character on screen makes physical contact with another character in a way that is intended to cause harm, including hitting, kicking, or pushing, as recorded by trained coders during a 30-minute programming segment.” This definition is specific and outlines a clear set of operations for measurement.

Operationalization involves making a series of crucial decisions, the most important of which is determining the level of measurement for your variable.
Levels of Measurement: Assigning Meaning to Numbers
Measurement, at its core, entails a numerical translation; it is the process by which we attach numbers to the values of our variables. The way we attach these numbers, and the meaning those numbers carry, is determined by the level of measurement. The level of measurement has profound implications for the kinds of statistical analyses that can be performed on the data. There are four hierarchical levels of measurement: nominal, ordinal, interval, and ratio.

Nominal Level
This is the least precise level of measurement. A variable measured at this level is also known as a categorical variable. At the nominal level, numbers are used simply as labels or names for different categories. The categories must be mutually exclusive (an observation can only fit in one category) and exhaustive (there is a category for every possible observation). The numbers themselves have no mathematical meaning; they only serve to distinguish one category from another.
Example: Common demographics are often nominal variables. “Type of Social Media Platform Used” might be coded as 1 = Facebook, 2 = Twitter, 3 = Instagram, 4 = TikTok. The number 4 is not “more” than the number 1; it is simply a different label.
Permissible Statistics: Frequency counts, percentages, and the mode (the most common category).
Ordinal Level
The ordinal level of measurement has the properties of the nominal level, but it adds the characteristic of rank order. The numbers attached to the values of a variable indicate a ranking from low to high or from least to most. What is missing at the ordinal level is the assumption that the distances between the ranks are equal.
Example: A survey question asks respondents to rank their top three sources of news. We know that the source ranked #1 is preferred over the source ranked #2, but we do not know by how much. The “distance” in preference between #1 and #2 might be much larger than the distance between #2 and #3.
Permissible Statistics: All statistics for nominal data, plus the median (the middle rank) and percentiles.
Interval Level
The interval level of measurement has all the properties of the ordinal level, but it adds the crucial assumption that the distances between the values are equal and meaningful. This means that equal differences between the numbers on the scale represent equal differences in the underlying variable being measured. What is missing at the interval level is a true or absolute zero point.
Example: Temperature measured in Fahrenheit or Celsius is a classic example. The distance between 30° and 40° is the same as the distance between 70° and 80°. However, 0° does not represent the absence of temperature. In communication research, the most common interval-level measures include the Likert scale and the semantic differential scale. A Likert scale asks respondents to indicate their level of agreement on a symmetric scale (e.g., 1 = Strongly Disagree to 5 = Strongly Agree). A semantic differential scale asks respondents to rate a concept on a scale between two opposite adjectives (e.g., “This news source is:” Unreliable —:—:—:—:—:—:— Reliable). In both cases, researchers assume the psychological distance between the points is equal.
Permissible Statistics: All statistics for ordinal data, plus the mean, standard deviation, correlation, and regression.
Ratio Level
This is the highest and most precise level of measurement. A ratio-level measure has all the properties of an interval measure. Still, it also includes an authentic and meaningful zero point, which indicates the absolute absence of the variable being measured. The presence of a true zero allows for the creation of meaningful ratios.
Example: The number of minutes a person spends watching television in a day is a ratio-level variable. Zero minutes means a genuine absence of watching TV. A person who watches for 120 minutes has watched for twice as long as a person who has watched for 60 minutes. Other examples include age, income, and the number of times a word is mentioned in a news article.
Permissible Statistics: All statistical procedures are available for ratio-level data.
The researcher must make a deliberate decision about the level of measurement they want to achieve for each variable. Generally, it is best to measure a variable at the highest, most precise level possible, as this provides more information and allows for a broader range of statistical analyses. A ratio-level measure can always be converted into a lower level (e.g., exact age can be collapsed into ordinal age categories), but the reverse is not possible.
Assessing the Quality of Measurement: Reliability and Validity
A measure can be precisely defined and meticulously executed, but if it is not a good measure, the research it produces will be worthless. But what makes a measure “good”? Before diving into the two essential criteria of reliability and validity, we must consider a fundamental challenge in the measurement process itself: reactivity. Reactivity refers to the problem of people changing their behavior simply because they know they are being observed. The very act of measurement can alter the phenomenon being measured, which threatens the accuracy of the findings.
To combat this, researchers sometimes employ unobtrusive measures, which are methods of collecting data that do not require the direct participation of the people being studied and, therefore, do not introduce the problem of reactivity. Examples include analyzing existing documents, observing behavior in public spaces without interacting with the subjects, or examining physical traces people leave behind. While not always possible, these measures can provide a valuable, non-reactive complement to more direct methods like surveys and experiments. With this challenge in mind, we can now turn to the two essential criteria for a good measure: its reliability and its validity.
Reliability: The Question of Consistency
Reliability refers to the stability or consistency of a measurement. A measure is reliable if it yields the same results each time it is used, assuming that the thing being measured has not actually changed. If you step on a bathroom scale five times in a row, a reliable scale will give you the same reading each time. An unreliable scale might give you five different readings, leaving you with no confidence in any of them. Reliability is about minimizing random measurement error—the unpredictable, chance variations that can occur in the measurement process. There are several ways to assess the reliability of a measure:
Test-Retest Reliability: This assesses the stability of a measure over time. It involves administering the same measure to the same group of people at two different points in time and then calculating the correlation between the two sets of scores. A high correlation indicates good test-retest reliability. This method is best for measuring stable traits, like personality, but can be problematic for measuring states that are expected to change, like mood.
Internal Consistency Reliability: This is used for measures that consist of multiple items that are all intended to measure the same underlying construct (e.g., a multi-item scale of communication apprehension). Internal consistency assesses how well the items on the scale “hang together.” The most common statistic used to measure internal consistency is Cronbach’s alpha, which calculates the average correlation among all the items on a scale. A high Cronbach’s alpha (typically.70 or higher) indicates that the items are all reliably measuring the same thing.
Inter-Coder (or Inter-Rater) Reliability: This is essential for research that involves human observers or coders, such as content analysis or observational studies. It measures the degree to which different, independent coders agree when applying the same coding scheme to the same set of data. High inter-coder reliability indicates that the coding is objective and not just the subjective judgment of one person.
Validity: The Question of Accuracy
While reliability is about consistency, validity is about accuracy. Measurement validity refers to the degree to which a measure actually captures the concept it is intended to measure. A scale can be perfectly reliable (consistent) but not valid (accurate). The bathroom scale that consistently tells you that you weigh ten pounds less than you actually do is reliable, but it is not valid. There are several ways to assess the validity of a measure, each providing a different kind of evidence:
Face Validity: This is the most basic and subjective assessment of validity. It asks whether a measure, “on the face of it,” appears to be measuring what it claims to measure. A survey item intended to measure job satisfaction that asks, “How satisfied are you with your job?” has high face validity. While it is a useful starting point, face validity is not considered strong evidence because it relies on subjective judgment.
Content Validity: This assesses how well a measure represents the full content and all the relevant dimensions of the conceptual definition. A final exam in a research methods course would have high content validity if its questions covered all the major topics discussed in the course. If it only asked questions about sampling, it would have low content validity. Content validity is typically assessed by consulting experts in the field.
Criterion-Related Validity: This assesses the validity of a measure by comparing it to an external criterion that it should, in theory, be related to. There are two types:
Predictive Validity: This assesses how well a measure predicts a future outcome that it is logically expected to predict. For example, the SAT is considered to have predictive validity if students’ scores on the test are shown to be correlated with their future grade point averages in college.
Concurrent Validity: This assesses how well a measure’s results correlate with the results of another, previously validated measure of the same concept that is administered at the same time. For example, a new, shorter scale of communication apprehension would have concurrent validity if scores on it were highly correlated with scores on an older, well-established, and longer scale.
Construct Validity: This is the most demanding and theoretically sophisticated test of validity. It asks whether a measure relates to other variables in ways that are consistent with the broader theoretical framework surrounding the construct. For example, a theory of political engagement might predict that engagement is positively related to political knowledge but negatively related to political apathy. To establish construct validity for a new measure of political engagement, a researcher would need to show that scores on their measure are, in fact, positively correlated with scores on a measure of political knowledge and negatively correlated with scores on a measure of political apathy.
The Relationship Between Reliability and Validity
Reliability and validity are distinct but related concepts.
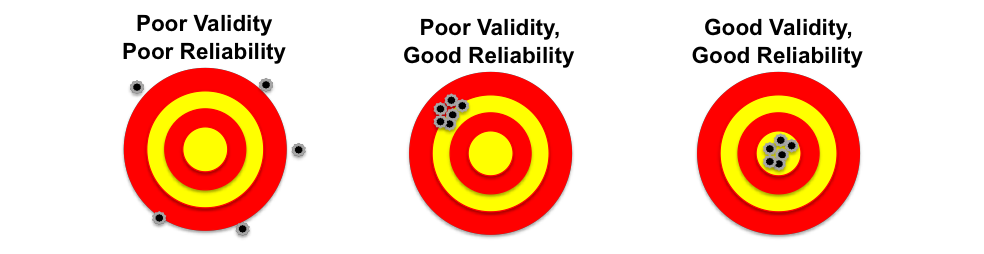
The relationship between them is best understood with a bullseye analogy. Imagine the center of the bullseye is the “true” value of the concept you are trying to measure.
An unreliable and invalid measure would be like arrows scattered all over the target, with no consistency and not hitting the center.
A reliable but invalid measure would be like a tight cluster of arrows that are all in the same spot, but that spot is far from the center of the bullseye. The measure is consistent, but it is consistently wrong.
A reliable and valid measure would be a tight cluster of arrows right in the center of the bullseye. The measure is both consistent and accurate.
From this, we can see a crucial relationship: Reliability is a necessary, but not sufficient, condition for validity. A measure cannot be valid (accurate) if it is not first reliable (consistent). If your measurements are fluctuating randomly, they cannot possibly be hitting the true target in a meaningful way. However, a measure can be perfectly reliable without being valid. Therefore, researchers must strive to establish both the consistency and the accuracy of their measurement instruments.
Conclusion: The Bedrock of Credible Research
Measurement is the bedrock upon which all empirical research is built. It is the deliberate and systematic process of translating our abstract theoretical ideas into concrete, observable evidence. This journey, from the initial clarification of concepts in conceptualization to the development of specific procedures in operationalization, is fraught with critical decisions that have profound implications for the quality and credibility of our research.
The choices we make about how to define our terms, what indicators and dimensions to include, what level of measurement to use, and how to assess the reliability and validity of our instruments are not mere technicalities. They are the very acts that determine whether our research will produce meaningful insights or just a collection of noisy, ambiguous data. A study with a sophisticated design and robust statistical analysis can still be rendered meaningless if its foundational measures are flawed. Therefore, the art of measurement is a skill that every researcher must cultivate with care, precision, and a deep commitment to the principles of rigorous inquiry. It is the essential craft that allows us to build a sturdy and trustworthy bridge from our most interesting questions to our most credible answers.
Journal Prompts
Choose an abstract concept that matters to you—something like identity, motivation, fandom, or stress. Now, imagine you’re going to study it for a research project. How would you go about clarifying its meaning? What dimensions or components would you want to include? Reflect on how difficult it is to turn a concept you feel into something you can study. What does this reveal about the importance of conceptualization?
Select one of the following concepts: political engagement, body image, media literacy, or interpersonal trust. First, write a short conceptual definition for the term in your own words. Then, brainstorm 2–3 specific ways a researcher might operationalize that concept. What kinds of survey questions, observational criteria, or behavioral measures might capture it? How do your choices shape what “counts” as evidence?
Think about a time you were measured or evaluated—maybe on a test, a performance review, or even a personality quiz. Did the measure feel reliable (consistent)? Did it feel valid (accurate)? Explain your experience and how it relates to the difference between reliability and validity. Why is it essential for a measure to be both? Which one seems more complicated to achieve, and why?