Chapter 2: The Infrastructure of Trust
Learning Objectives
- Understand why reproducibility is foundational to credible research
- Recognize how computational workflows document analytical decisions
- Grasp the distinction between static documents and dynamic, transparent reports
- Learn to work with Markdown before introducing code
In 2015, a large collaborative team of psychologists attempted something simultaneously mundane and revolutionary: they tried to replicate 100 published studies from top-tier journals. Not to expose fraud, but to test whether the published methods were sufficient to reproduce the results. The success rate was 36 percent (Open Science Collaboration, 2015).
This wasn’t a scandal in the traditional sense. No one had fabricated data or p-hacked their way to significance (at least, not intentionally). The problem was more subtle and more pervasive. The original researchers had made dozens of small, reasonable decisions during analysis: how to handle outliers, which covariates to include, how to operationalize ambiguous concepts. These decisions weren’t necessarily wrong, but they were undocumented, existing only in the researchers’ memories or lost in the sequence of mouse clicks through statistical software.
The replication crisis, as it came to be known, revealed something uncomfortable: much of what we called “knowledge” was actually fragile. The published papers described what researchers found, but not with sufficient precision to allow others to verify the findings. Science had promised cumulative, verifiable knowledge. Instead, it had produced a literature that was, in many cases, unreproducible by design.
The problem extended well beyond psychology. The statistician John Ioannidis (2005) had made the provocative case, a decade earlier, that most published research findings are false, arguing that small sample sizes, flexible analytical practices, and publication bias systematically inflate false positive rates across the sciences. Simmons, Nelson, and Simonsohn (2011) demonstrated the mechanism empirically: they showed that undisclosed flexibility in data collection and analysis, what they called “researcher degrees of freedom,” could make it trivially easy to produce statistically significant results from pure noise. In one memorable demonstration, they used these flexible practices to “prove” that listening to a particular Beatles song made people literally younger.
These findings didn’t invalidate science. They revealed that credibility depends not just on what researchers find, but on how transparently they document the process of finding it. And that transparency depends, in turn, on infrastructure.
The Point-and-Click Problem
Consider a typical research workflow in many undergraduate courses:
You collect data in a spreadsheet. You import it into statistical software, SPSS, perhaps, or Stata. You click through menus to generate descriptive statistics, run tests, and create visualizations. You copy and paste the output into a Word document, manually formatting tables and adjusting decimal places. You write your interpretation around these pasted results. You submit the document.
There’s nothing obviously wrong with this process. It produces a document that looks professional. It communicates findings. But it has a critical flaw: it leaves no trail.
If someone asks, “How did you clean the data?” you might remember. Or you might not. If they ask, “Did you exclude any cases?” the answer exists only in your recollection. If your data changes, new observations arrive, errors are discovered, you must repeat every manual step, hoping you remember the exact sequence of operations.
More fundamentally, this workflow treats research as a performance that produces a static artifact, the final document, rather than as a process that should be transparent and verifiable. The product (the Word doc) hides the decisions that shaped it. And as the replication crisis demonstrated, those decisions matter enormously.
This problem isn’t unique to academic research. Journalists, policy analysts, and data scientists face the same challenge. When a news organization publishes a data-driven investigation but can’t explain how it cleaned the dataset, the findings are impossible to verify. When a government report reaches a conclusion but the analytical steps are buried in a proprietary spreadsheet, public trust erodes. Transparency isn’t an academic virtue. It’s a democratic one.
Code as Documentation
In 1984, computer scientist Donald Knuth proposed something he called “literate programming” (Knuth, 1984). The idea was simple but radical: what if code and explanation existed in the same document, woven together so that a reader could understand not just what the program did but why it did it that way?
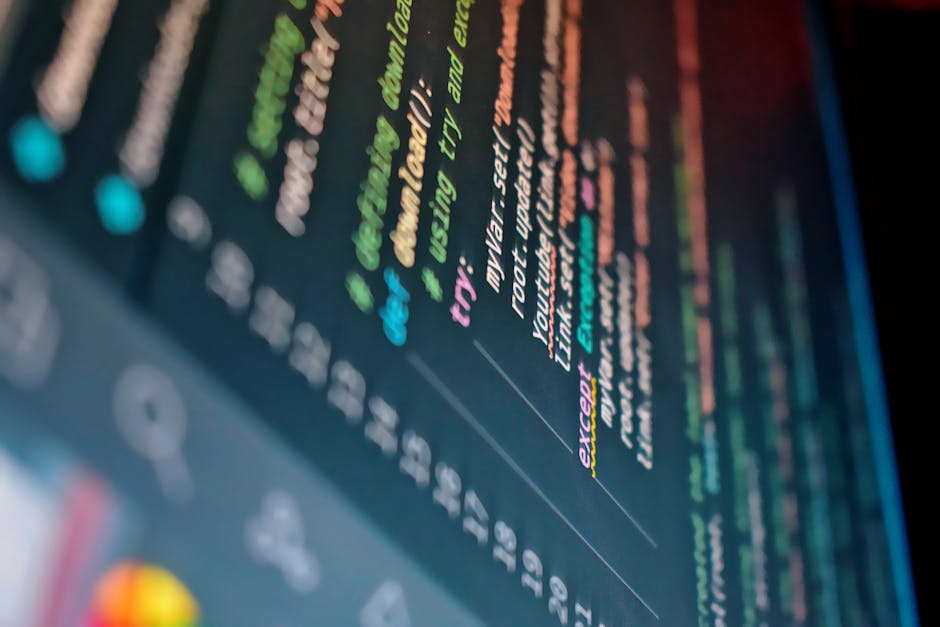
For decades, this remained a niche concept in software engineering. But in recent years, it’s become the foundation of reproducible research in data science and empirical social science. Modern tools, particularly Quarto and its predecessor R Markdown, realize Knuth’s vision by allowing researchers to create documents that integrate narrative text, executable code, and output in a single file.
Here’s what that looks like in practice:
A Quarto document (saved with a .qmd extension) contains:
- Narrative text: Your explanations, interpretations, and context, written in a lightweight formatting language called Markdown.
- Executable code: Chunks of R code that load data, clean it, analyze it, and generate visualizations.
- Output: Tables, figures, and statistical results that are generated automatically when the document is rendered.
The key insight is this: when you write a Quarto document, you’re not just recording results; you’re recording the recipe that produced those results. If the data changes, you don’t rewrite the recipe. You just run it again, and the output updates automatically.
This transforms the final document from a static claim (“Here’s what I found”) into a transparent process (“Here’s how I found it, and here’s the code so you can verify it yourself”).
The Spectrum of Reproducibility
Reproducibility isn’t binary. It exists on a spectrum, and understanding that spectrum helps clarify what we’re aiming for:
Level 0: Publication Only
You publish a paper describing your methods. No data, no code. Replication requires someone to reconstruct your dataset from scratch and guess at your analytical choices.
Reproducibility: Approximately 0%
This was the norm for much of the 20th century. It’s increasingly unacceptable.
Level 1: Data Sharing
You publish the paper and upload your raw data to a repository like OSF or Dataverse. Others can verify your descriptive statistics, but they can’t see the steps between raw data and final results.
Reproducibility: Approximately 30%
This is better, but still incomplete. The analytical pipeline, the sequence of transformations, exclusions, and calculations, remains opaque.
Level 2: Code Sharing
You share both data and scripts. Others can, in theory, run your code and reproduce your results. But scripts often assume specific directory structures, package versions, or operating systems. What works on your computer may fail on someone else’s.
Reproducibility: Approximately 60%
Progress, but fragile.
Level 3: Computational Environment
You use tools like renv (for R) or Docker (for containerized environments) to document package versions and system dependencies. Others can replicate your exact computational setup.
Reproducibility: Approximately 85%
This is robust, but requires technical sophistication.
Level 4: Literate, Executable Documents
You publish a Quarto document (or Jupyter Notebook) that contains narrative, code, data links, and output in a single, self-contained file. Anyone can click “Render” and regenerate the entire report from raw data to formatted text.
Reproducibility: Approximately 95%
This is the goal. It’s not perfect, there are still edge cases involving operating systems or deprecated packages, but it’s as close as we can reasonably get.
This course trains you to work at Level 4.
Why This Matters Beyond Academia
Reproducibility is sometimes framed as an academic virtue, something important for peer review but irrelevant in applied settings. This is a misunderstanding.
In industry, reproducibility is a practical necessity. If you’re a data analyst at a media company and your manager asks, “Why did engagement drop last quarter?” a static PowerPoint deck is insufficient. They need to interrogate your assumptions, adjust parameters, and explore alternative explanations. A reproducible analysis, code that can be re-run with different filters or timeframes, allows for that exploration.
In journalism, reproducibility is an emerging standard of credibility. When The New York Times publishes an investigation into racial disparities in policing, or when ProPublica releases an analysis of algorithmic bias in criminal sentencing, they increasingly publish the underlying data and code on GitHub. They’re signaling confidence: “We’re showing our work. You can verify it.” The Bureau of Investigative Journalism, FiveThirtyEight, and The Economist have adopted similar practices. A reader who distrusts the conclusion can examine the methodology, and that is precisely the point.
In public policy, reproducibility is a defense against motivated reasoning. When competing interest groups cite the “same” data but reach opposite conclusions, transparent analytical methods allow third parties to identify where assumptions diverge.
For your future self, reproducibility is an act of kindness. Six months after completing a project, you will have forgotten the reasoning behind specific decisions. A well-documented Quarto file serves as a time capsule, reminding future you what past you was thinking.
The Tools
Four tools form the core of a reproducible workflow. Understanding what each does, and why it matters, helps demystify what might otherwise feel like an overwhelming technical stack.
R: The Statistical Engine
R is a programming language designed for statistical analysis and data visualization. Unlike commercial software like SPSS, R is:
- Free and open-source: No licensing barriers or institutional dependencies.
- Extensible: Thousands of community-contributed packages extend its capabilities for text analysis, network analysis, machine learning, and more.
- Scripted: Every operation is recorded as code, making analysis inherently reproducible.
Why not Python? Python is excellent for machine learning, web scraping, and general-purpose programming. Both languages are valuable. This course uses R because of its tight integration with Quarto and its rich ecosystem for statistical analysis in the social sciences.
RStudio: The Development Environment
RStudio is an interface that makes R easier to use. It provides:
- A script editor with syntax highlighting and code completion.
- A console for running code interactively and seeing immediate results.
- Panes for viewing plots, data frames, and help documentation.
- Built-in support for Quarto, Git, and project management.
Think of R as the engine and RStudio as the dashboard. You could drive without a dashboard, but it would be unnecessarily difficult.
Quarto: The Publishing System
Quarto converts plain-text files (with code embedded) into polished reports. Key features include:
- Multi-format output: Write once, render to HTML, PDF, Word, or PowerPoint.
- Automatic cross-referencing: Figures and tables are numbered automatically; if you add a new figure, all subsequent references update.
- Citation management: Integrate bibliographies using BibTeX or CSL files.
- Reproducibility by design: If a code chunk fails during rendering, the entire process fails. This prevents silent errors from propagating into the final document.
Quarto is the successor to R Markdown, with better performance and support for multiple programming languages.
Git and GitHub: Version Control
Git is a version control system. It tracks every change to your files, allowing you to revert to earlier versions, compare changes over time, and collaborate without overwriting each other’s work.
GitHub is a hosting platform for Git repositories. It provides:
- Backup: Your work is stored in the cloud.
- Collaboration: Multiple people can work on the same project simultaneously.
- Transparency: Public repositories demonstrate your skills to employers or graduate programs.
- Deployment: GitHub Pages can host your final portfolio as a live website.
If you’ve used Google Docs, you’ve experienced a lightweight version of version control, the ability to see revision history and revert to earlier drafts. Git offers the same functionality but for entire projects: data files, code scripts, documentation, everything.
The Philosophy of the One-Click Report
The ultimate goal of this workflow is what we might call the “one-click report”: a Quarto document that, when rendered, regenerates your entire analysis, from loading raw data to producing final figures to formatting the text around those figures.
This isn’t just about convenience. It’s about accountability.
When your analysis is encoded as a script rather than buried in your memory, it becomes inspectable. Someone else can read your code and understand exactly what you did. They can identify potential errors. They can suggest improvements. They can verify that your conclusions follow from your methods.
This transparency also protects you. If someone questions your findings, you can point to the code and say, “Here’s what I did. Run it yourself.” No ambiguity, no lost details, no relying on memory.
The principle of reproducibility scales. The same logic that governs a semester-long content analysis project governs a multi-year clinical trial. The same logic that makes a student’s Quarto document trustworthy makes a government statistical report auditable. The tools differ in complexity, but the intellectual commitment is identical: show your work.
Starting Simply: Obsidian and Markdown
Here’s a pedagogical decision that might seem counterintuitive: you will not install RStudio or R yet.
Instead, you’ll start with Obsidian, a note-taking application that uses Markdown, the same lightweight formatting language that underlies Quarto documents. This separation is intentional.
The problem with diving straight into RStudio: It’s overwhelming. You encounter a complex interface with multiple panes, a console that displays cryptic error messages, package managers, and file systems. The cognitive load is high, and frustration often sets in before understanding develops.
A better approach: Learn Markdown first in a clean, forgiving environment. Master the formatting language. Get comfortable with plain-text workflows. Then introduce R when you actually need to analyze data.
Why Obsidian?
Obsidian is designed for researchers, students, and knowledge workers. It stores notes as plain-text Markdown files, which means:
- No lock-in: Your notes are yours, stored as simple text files, readable in any editor.
- Linking: You can create connections between notes, building a network of related ideas (sometimes called a “second brain”).
- Simplicity: The interface is clean and distraction-free, focused on writing and thinking rather than formatting.
What you’ll learn in Obsidian:
- Markdown syntax (headings, lists, bold, italics, links)
- Organizing research notes with folders and tags
- Creating internal links between concepts
- Exporting notes for sharing
- Maintaining a structured project workflow
Critical skill transfer: Everything you learn about Markdown in Obsidian applies directly to Quarto. When you eventually write a research report in Quarto and see # Introduction, you’ll already know it creates a top-level heading. The syntax is identical. You’re not learning two systems; you’re learning one syntax in two contexts.
Setting Up Obsidian
Step 1: Installation
- Visit https://obsidian.md/
- Download the free version for your operating system (Windows, Mac, or Linux)
- Run the installer with default settings
- On first launch, create a new vault (a vault is just a folder where Obsidian stores notes)
- Name it something like
MC451-ResearchorResearch-Notes
Step 2: Your First Note
- Click the “New Note” button (or press Ctrl+N on Windows, Cmd+N on Mac)
- Name it “Research Topic Brainstorm”
- Start typing
Obsidian renders Markdown in real-time. As you type formatting codes, you’ll see them transform into formatted text.
Try this:
# Research Topic Brainstorm

## Why This Topic Interests Me

I've noticed a pattern in the data I want to explore. Before I can
test it systematically, I need to articulate what I think is happening
and what evidence would change my mind.

## Initial Questions

- What relationship am I curious about?
- What variables would I need to measure?
- What would a null result look like?

## Data Sources

Our course dataset includes:
- Billboard chart data (rankings, weeks on chart)
- Spotify audio features (tempo, energy, valence)
- Genius lyrics and metadata

## Next Steps

- [ ] Review literature on my topic
- [ ] Identify variables in the dataset relevant to my questions
- [ ] Begin developing operational definitions
Step 3: Organizing Notes
Create folders to organize your research:
- Right-click in the file list
- Select “New Folder”
- Create folders for:
01-Literature-Notes(summaries of articles you read)02-Project-Planning(research questions, hypotheses)03-Coding-Notes(qualitative coding decisions)04-Analysis-Memos(thoughts during data analysis)
This structure mirrors the phases of research you’ll work through this semester.
Step 4: Linking Ideas
Obsidian’s distinctive feature is the ability to link notes. Suppose you create a note about “Uses and Gratifications Theory” after reading a relevant article. In your brainstorming note, you can link to it:
## Theoretical Framework

This project might draw on [[Uses and Gratifications Theory]], which
suggests that people actively select media to fulfill specific
psychological needs.
Clicking that link navigates to the theory note. Over time, these links create a web of connected ideas, a knowledge graph that reflects how your thinking evolves.
Creating a GitHub Account
While we’re setting up infrastructure, create a GitHub account:
- Visit https://github.com/
- Sign up for a free account (use a professional username; this will eventually be part of your public portfolio)
- Verify your email address
You won’t use GitHub immediately, but having an account now means you’ll be ready when we introduce version control in later chapters.
A Note on Deferred Complexity
You might notice what we’re not doing yet: installing R, configuring RStudio, and learning statistical syntax. This is intentional.
Research methods courses often overwhelm students by introducing too many new concepts simultaneously: statistical theory, coding syntax, software interfaces, and domain knowledge all at once. The result is cognitive overload and frustration.
A better approach sequences complexity:
- First: Learn to organize thoughts and write in Markdown (this chapter).
- Second: Develop research questions, theoretical frameworks, and ethical awareness (Chapters 3-8).
- Third: Engage in qualitative and methodological analysis using tools you already understand, text and categories (Chapters 9-16).
- Fourth: Introduce computational tools when they solve a problem you’ve already encountered (Chapters 17-20).
By the time you install R and RStudio (Chapter 17), you’ll have context for why these tools are useful. The syntax won’t feel arbitrary because you’ll understand the research problem it’s solving.
The Obsidian Habit: Research Log
Starting this week and continuing throughout the semester, maintain a research log in Obsidian. Each week, create a note titled Week [N] - Research Log with the following prompts:
- What I learned this week (about methods, theory, or the dataset)
- Questions I’m wrestling with (confusions, curiosities, uncertainties)
- Connections I’m seeing (links between concepts, theories, or data patterns)
- Next steps (what I need to do or learn next)
This habit serves multiple purposes:
- It creates a chronological record of your thinking.
- It surfaces confusions while they’re still fresh, making them easier to resolve.
- It helps you notice patterns across weeks (recurring questions might signal a gap in understanding).
- It provides material for reflection assignments and helps you write more authentic discussion sections in your final report.
Practice: Markdown Fluency
Exercise 2.1: Formatting Practice
Create a new note in Obsidian and practice the following Markdown syntax:
- Create three levels of headings (
#,##,###) - Write a bulleted list with at least three items
- Write a numbered list
- Make some text bold and some text italic
- Create a hyperlink to an external website
- Create an internal link to another note (real or imagined)
Goal: Develop muscle memory for basic Markdown before you need it in Quarto documents.
Exercise 2.2: Research Note Structure
Create a note titled “Potential Research Topics” and brainstorm three possible research questions you could explore with the course dataset. For each question:
- State the question clearly
- Identify what data you’d need to answer it
- Note one challenge or limitation you might face
- Link to a concept note (e.g., “This relates to [[Sentiment Analysis]]”)
Goal: Practice organizing research thoughts in a structured, retrievable way.
Exercise 2.3: Literature Summary Practice
Find a recent article (past 5 years) about media, communication, or social behavior. It doesn’t need to be a research article. A well-reported piece from The New York Times, The Atlantic, or Vox works fine. It can be about music, news, social media, advertising, health communication, or any other domain.
Create a note titled “[Article Title] - Summary” and include:
- Citation (author, publication, date, URL)
- Main argument (1-2 sentences)
- Key evidence (what data or examples support the argument?)
- Relevance to research methods (what kind of study could test this argument more rigorously?)
- Questions or critiques (what’s missing? what would you want to know more about?)
Goal: Develop the habit of active reading and note-taking. This is the foundation of literature reviews.
Reflection Questions
Reproducibility and Trust: Think about a time you encountered a claim supported by data (in news media, social media, or elsewhere). Did you trust it? What would have increased your confidence? Would access to the underlying code and data have mattered?
Workflow Anxiety: Many students feel intimidated by the prospect of learning code-based workflows. What aspects feel most daunting? What strategies might help manage that anxiety? (This is a genuine question. There are no wrong answers, and articulating fears often makes them more manageable.)
The Value of Process: This chapter argues that research should document process, not just results. Why might this matter? What gets lost when we only see final products rather than the decisions that shaped them?
Reproducibility Beyond Research: Can you think of contexts outside academic research where reproducibility matters? Consider journalism, public policy, business analytics, or legal evidence. What would transparent analytical methods look like in those fields?
Chapter Summary
This chapter introduced the infrastructure of reproducible research:
- The replication crisis (Open Science Collaboration, 2015) revealed that much published research cannot be reproduced because analytical decisions were undocumented.
- Researcher degrees of freedom (Simmons et al., 2011) allow analysts to produce significant results from noise through undisclosed flexibility in data collection and analysis.
- Code-based workflows solve this problem by making every step of analysis transparent and re-runnable, following the literate programming principle first articulated by Knuth (1984).
- Reproducibility exists on a spectrum, from no data sharing (Level 0) to fully executable documents (Level 4). This course targets Level 4.
- The one-click report philosophy: a Quarto document should regenerate your entire analysis from raw data to formatted output.
- We start with Obsidian and Markdown to build familiarity with plain-text workflows before introducing R and RStudio.
- Git and GitHub provide version control and collaboration infrastructure, though we won’t use them heavily until later chapters.
- Reproducibility is not just an academic concern. It matters in journalism, policy analysis, industry, and any domain where trust in evidence is at stake.
Key Terms
- Computational reproducibility: The ability to regenerate results using the same data and code
- Git: A version control system that tracks changes to files over time
- GitHub: A cloud-based hosting platform for Git repositories
- Literate programming: The practice of weaving code and narrative explanation together (Knuth, 1984)
- Markdown: A lightweight formatting language for creating structured documents
- Obsidian: A note-taking application that uses plain-text Markdown files
- Quarto: A publishing system that converts code-embedded documents into polished reports
- R: A programming language designed for statistical analysis
- Replication crisis: The finding that many published studies cannot be reproduced (Open Science Collaboration, 2015)
- Researcher degrees of freedom: Undisclosed flexibility in data collection and analysis that inflates false positive rates (Simmons et al., 2011)
- RStudio: An integrated development environment (IDE) for R
- Tidy data: Data organized so each row is an observation, each column a variable, and each cell a single value (Wickham, 2014)
References
Ioannidis, J. P. A. (2005). Why most published research findings are false. PLoS Medicine, 2(8), e124. https://doi.org/10.1371/journal.pmed.0020124
Knuth, D. E. (1984). Literate programming. The Computer Journal, 27(2), 97-111. https://doi.org/10.1093/comjnl/27.2.97
Open Science Collaboration. (2015). Estimating the reproducibility of psychological science. Science, 349(6251), aac4716. https://doi.org/10.1126/science.aac4716
Simmons, J. P., Nelson, L. D., & Simonsohn, U. (2011). False-positive psychology: Undisclosed flexibility in data collection and analysis allows presenting anything as significant. Psychological Science, 22(11), 1359-1366. https://doi.org/10.1177/0956797611417632
Wickham, H. (2014). Tidy data. Journal of Statistical Software, 59(10), 1-23. https://doi.org/10.18637/jss.v059.i10
Required Reading: Simmons, J. P., Nelson, L. D., & Simonsohn, U. (2011). False-positive psychology: Undisclosed flexibility in data collection and analysis allows presenting anything as significant. Psychological Science, 22(11), 1359-1366. https://doi.org/10.1177/0956797611417632
Prompt: Simmons et al. demonstrate that “researcher degrees of freedom,” seemingly innocuous choices about sample size, variable selection, outlier exclusion, and analytical strategy, can produce statistically significant results from data containing no real effects. Their demonstration that listening to “When I’m Sixty-Four” could be shown to make people younger is both absurd and alarming.
- Identify three specific “degrees of freedom” that could arise in a content analysis study. For example: how you define the sampling frame, which edge cases you include or exclude from coding, how you handle disagreements between coders, which variables you ultimately analyze, and how you operationalize key constructs.
- For each degree of freedom, explain how it could plausibly influence results in a particular direction.
- How does a pre-registered codebook (developed before data analysis begins) function as a defense against these flexible practices? What can it constrain, and what remains flexible even with pre-registration?
- Simmons et al. propose specific solutions, including disclosure requirements and a 20-subject-per-cell minimum for experiments. Which of their recommendations translate directly to content analysis research? Which don’t, and why?
Looking Ahead
Chapter 3 introduces the practice of systematic reading and research journaling. You’ll learn to read academic articles strategically, manage citations using Zotero, build a knowledge network in Obsidian, and distinguish between summarizing individual sources and synthesizing insights across them. These skills lay the groundwork for Part II, where you’ll design your own study by building on existing knowledge rather than starting from scratch.